HTML Reports Overview#
MEGqc produces interactive HTML reports. Figures are “lazy-rendered”, only the active tab’s content is rendered, this keep large reports responsive and avoid lagging. The reports can be generated at four scopes. In the following sections we will cover each of them:
QA Subject reports (per subject)
QA Group reports (per dataset)
QC Group reports (per dataset, Global Quality Index centered)
Multisample reports (cross-dataset comparison): it can be either for QA or QC.
Report Overview
This section explains report structure and interpretation. For run commands and GUI clicks, use the Tutorial.
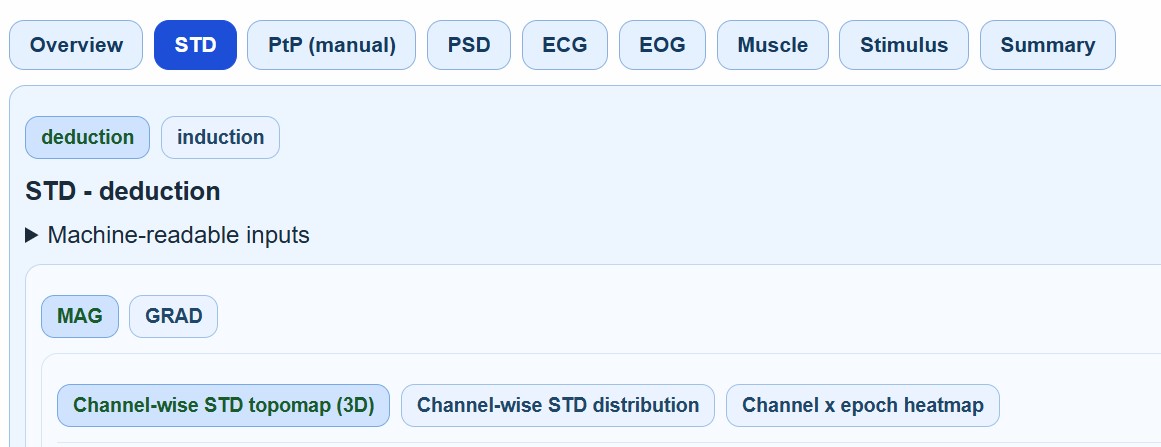
All reports are structured in a “nested-tab-hierarchy”.
Hierarchy level |
Content |
|---|---|
Level 1 |
Top tabs: |
Level 2 |
Task subtabs (e.g., deduction and induction) |
Level 3 |
Channel-type subtabs: |
Level 4 |
Plot subtabs: metric-specific visualizations (e.g., Channel-wise STD topomap (3D)) |